Hardik's Notes · AI, simply
Every AI chip on one chart: from 2 watts to a data centre
MIT Lincoln Laboratory plots AI chips by speed and power. The chart shows why a camera and a data centre need different chips.
What is this chart?
MIT Lincoln Laboratory has kept a list of AI chips (called accelerators) since 2018. It plots each one by two numbers: how fast it can go at most, and how much power it needs at most.
MIT News wrote about the survey on 6 October 2026. The latest paper was posted on arXiv on 23 October 2025. The first paper covered 57 accelerators. The latest covers more than 120.
What does it show?
The authors sort the chips into five groups by where they are used: very low power (such as wake-word detection), embedded (cameras, small robots), autonomous (driver assistance), and two data-centre groups.
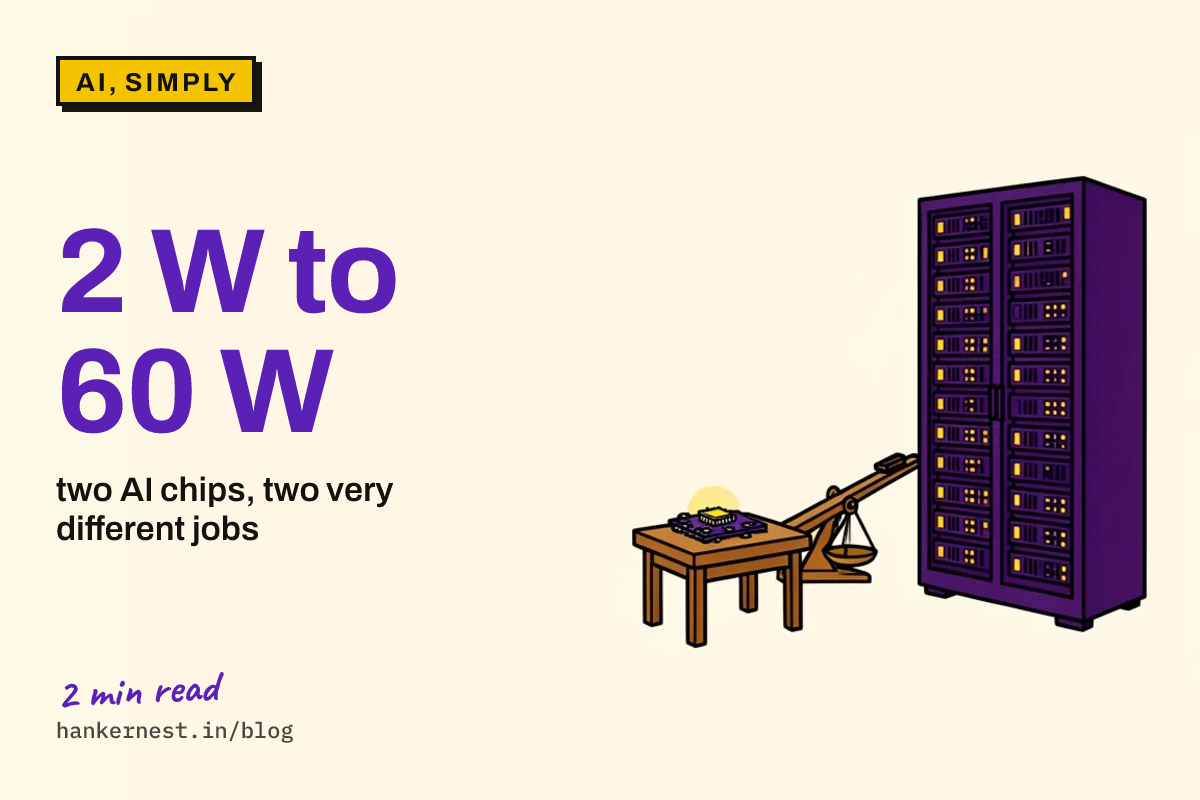
Hailo-15H
- Up to 20 trillion operations a second
- Peak power 2 watts
- About 10 trillion operations per watt
Jetson AGX Orin
- Up to 138 trillion operations a second
- Peak power 60 watts
- About 2.3 trillion operations per watt
Both are quoted at int8 (numbers stored in 8 bits, which is enough for most AI that is already trained). These are the makers’ peak figures, not tests. They show the trade: more speed costs far more power.
Why should you care?
A small camera or robot has a small power budget. A data-centre chip has a far larger one. An AI idea has to be squeezed to fit the first.
The paper also says int8 is the usual choice for running trained models. Smaller numbers save energy.
What’s the catch?
- The chart uses public numbers only. Some companies do not publish theirs.
- Peak speed is not real speed. A program may reach only part of it.
- The survey covers chips for running trained models, mainly. Training is a different story.
Try it
Download the 2025 data file from the survey’s GitHub page. Plot the Power column against the PeakPerformance column on log scales. Pick out a chip you have heard of and see which group it falls in. If you share your chart, cite the survey’s papers, as its authors ask.
Sources
- Supercomputing researchers document evolution of AI hardware, MIT News, 6 October 2026
- Lincoln AI Computing Survey (LAICS) and Trends, Reuther and others, arXiv, 23 October 2025
- ai-accelerators: survey data and papers, GitHub
Keep reading
Three more from the notebook.
8 October 2026
How Google steers an AI image maker without rebuilding it
Ask for a lizard in sunglasses and you may get a lizard with none. Google Research built a small add-on that steers the model.Read it5 October 2026
Open now: 5 contests for students (October 2026)
Five contests students in India can enter now, from a one-weekend NASA hackathon to a 10,000 dollar environment prize. Deadlines from 29 October.Read it22 September 2026
How to find the one thing that is broken
Your circuit will not light. Your code will not run. Here is the method engineers use, and it works on homework too.Read it
Beyond the notebook
This is what we do in schools.
A year-long programme for classes 6 to 12. Creativity, taught as a skill, inside the classroom you already have, led by your teachers.