Attention Is All You Need: The Paper Behind Modern AI

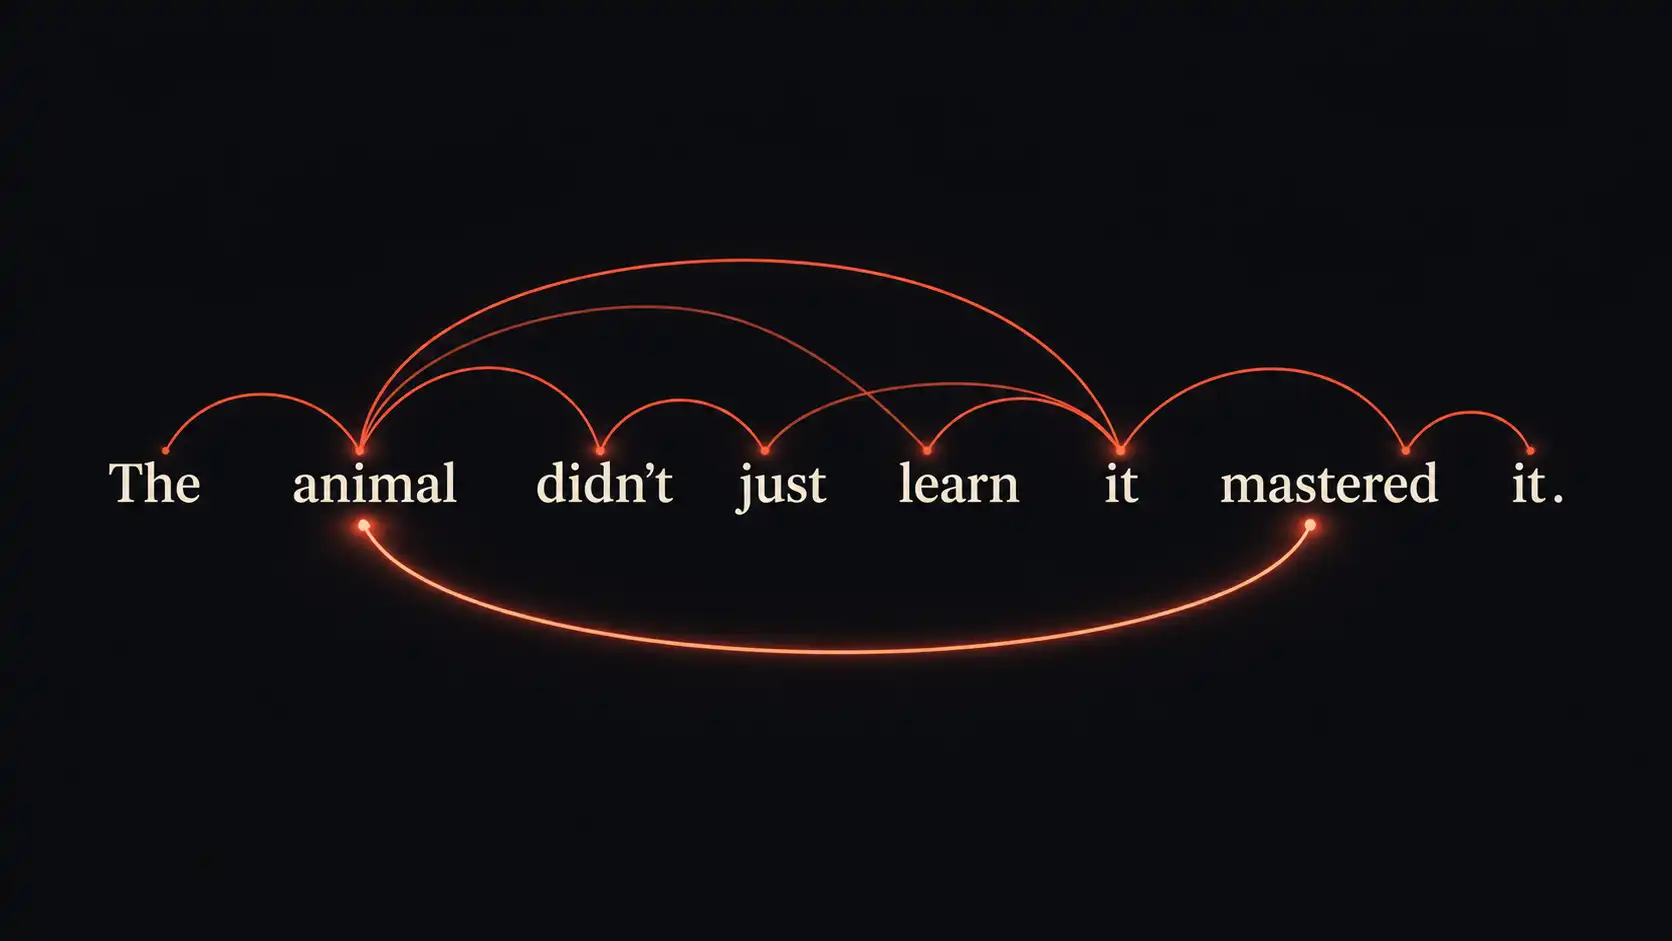
The nine pages that built ChatGPT In June 2017, eight researchers at Google published a paper with a slightly cheeky title: “Attention Is All You Need.” It was about machine translation, a narrow and unglamorous corner of AI. It was nine pages long. It did not announce itself as the most important paper of the decade. It was the most important paper of the decade. Almost every AI system you have heard of, ChatGPT, Claude, Gemini, the tools writing code and drafting emails and answering homework, is a direct descendant of this one paper. The architecture it introduced is called the Transformer. That is the “T” in GPT. If you want to understand why AI suddenly got good around 2023, the story starts here, in 2017, with a paper most of the world never read. Here is what it actually said, without the maths degree. The problem: AI used to read one word at a time To see why the paper mattered, you have to see what it replaced. Before 2017, the best language models read text the way you might read through a keyhole: one word at a time, left to right, trying to hold everything that came before in a kind of running memory. These were called recurrent networks. They worked, but they had two deep problems. First, they were slow. Because each word had to wait for the previous word to be processed, you could not do the work in parallel. The model was stuck reading in single file. Second, they were forgetful. By the time the model reached the end of a long sentence, the beginning had faded. Ask it to connect a word at the end of a paragraph to something near the start, and the thread had often gone cold. The memory leaked. Both problems came from the same root: the model processed words in sequence, one after another, carrying a fragile memory forward. What if it did not have to? The big idea: let every word see every other word at once Here is the move that changed everything. Instead of reading in order and trying to remember, let every word look directly at every other word in the sentence, all at the same time, and decide for itself which ones matter. That is attention. More precisely, self-attention. Take the sentence in the demo above: “The animal didn’t cross the street because it was too tired.” What does “it” refer to? You know instantly, without thinking, that “it” means the animal, not the street. That little act of connecting “it” back to “animal” across a gap of several words is exactly what attention does. The model lets “it” reach across the whole sentence and pull hardest on the word that matters most to it. No reading in single file. No fading memory. Every word, connected to every other word, in one parallel step. Click around the demo above and you are watching this happen: each word casts a different web of attention over the rest of the sentence. How attention actually works: the library analogy So how does a word “decide” what to pay attention to? This is the part with the famous three letters: Q, K, V. They sound intimidating. They are not. Every word produces three things: Think of a library. You walk in with a request slip, that is your query. Every book has a label on its spine, that is its key. You compare your slip against all the labels, and the ones that match best are the books you want. You then pull those books and read their contents, the values, paying most attention to the books that matched your request most closely. That is all attention is. Each word’s query is compared against every word’s key. Strong matches get high scores. Those scores become weights. And the word builds its new understanding as a blend of everyone’s values, weighted by how well they matched. The paper writes this as one line: softmax(QK^T / √d_k)V. Do not let it scare you. Read left to right it just says: score every pair (QK^T), shrink the numbers so they behave (√d_k), turn them into clean weights that add up to one (softmax), then use those weights to blend the values (V). Score, normalise, blend. That is the whole engine. Multi-head attention: several perspectives at once One pass of attention captures one kind of relationship. But language has many at once. There is grammar (which verb goes with which subject), there is reference (what does “it” point to), there is topic, tone, and more. So the Transformer does not run attention once. It runs it several times in parallel, each with its own set of queries, keys and values. These are the “heads.” One head might learn to track grammatical agreement, another might track which pronoun refers to what, another might follow the topic. Then their findings are combined. Picture several expert readers each marking up the same sentence for a different thing, then merging their notes into one richer understanding. That is multi-head attention, and it is why the architecture captures the layered, overlapping meaning that real language carries. Why it actually mattered: it could be parallelized Now the deep reason this paper won, the reason that matters more than any single clever mechanism. Because attention looks at all words at once instead of one at a time, the whole computation can be done in parallel. And parallel computation is exactly what modern hardware, the GPUs that power AI, is built to do. The old sequential models left most of that hardware idle, waiting in line. The Transformer could light all of it up at once. That unlocked scale. You could train on far more text, far faster, than ever before. And it turned out that when you make these models bigger and feed them more, they keep getting better, an effect that the entire current AI boom is built on. None of that scaling would have been practical

Attention Is All You Need: The Paper Behind Modern AI Read Post »

The Open vs Closed AI Gap Is Closing. 6 Charts.

The two-year head start is gone For years there was a simple rule about AI models. The good ones, GPT, Claude, Gemini, were closed. You rented them through an API, your data went to someone else’s servers, and the free open models you could download and run yourself were a noticeable step behind. Maybe two years behind. That rule is breaking. Open-weight models, the ones anyone can download, run on their own hardware, and use for free, have closed most of the gap. On some tasks the gap is now zero. On the hardest, it is single digits and shrinking every quarter. This matters for anyone, but it matters especially for a school, a college, or anyone who cares where their data goes. Because “almost as good as the frontier, free, and running on your own machine” is a genuinely different proposition from “rent it and send your data away.” Here is where things actually stand, in six charts. A note first: exact scores move every month as new models launch, so treat the numbers as a snapshot, not gospel. The trend is the point, and the trend is not in doubt. Chart 1: The overall gap has closed dramatically The cleanest single measure of convergence is the Chatbot Arena leaderboard, where real users blind-vote between models. It captures overall preference, not one narrow skill. The overall gap, closing fast Chatbot Arena: best closed minus best open (% points) Source: Stanford AI Index 2025 Chart 1 — The overall gap, closing fast A line chart over time. The performance gap between the best closed model and the best open model on the Chatbot Arena leaderboard fell from 8.0% in January 2024, to roughly 4.2% by mid-2024, to just 1.7% by February 2025. Source: Stanford AI Index 2025 (Chatbot Arena). In early 2024, the best closed model led the best open model by 8 percentage points on the Chatbot Arena leaderboard. A year later that lead had shrunk to 1.7 points. The gap did not narrow slowly, it collapsed in about twelve months. On broad knowledge tests the convergence is now so complete that older benchmarks like MMLU have been retired from serious leaderboards, because nearly every capable model scores above 90 and the test no longer separates anyone. Chart 2: On hard science, a real gap remains It would be dishonest to stop at the benchmark everyone aces. On harder tests, the closed models still lead. Where things stand now, by task Best closed (cream) vs best open (orange), % score Source: Vellum LLM & open-LLM leaderboards, 2026 Chart 2 — Where things stand now, by task A grouped bar chart comparing the best closed model (cream) against the best open model (orange) across four benchmarks, % score. Math (AIME 2025): closed 100 vs open 99.1. Science (GPQA Diamond): 94.2 vs 87.6. Coding (SWE-bench): 88.6 vs 76.8. Hardest exam (Humanity’s Last Exam): 57.9 vs 44.9. Source: Vellum LLM and open-LLM leaderboards, 2026. On GPQA Diamond, a test of graduate-level physics, chemistry and biology reasoning, the frontier closed models sit in the low-to-mid 90s. The best open models reach the mid-80s. That is a real, single-digit-to-low-double-digit gap, and it is the honest counterweight to “open has caught up.” On the genuinely hard reasoning, it hasn’t, quite. But “a few points behind the best in the world” is a very different sentence from “two years behind.” Chart 3: The gap, task by task The single-number gap hides the real story, which is that it varies enormously by task. Software engineering is the benchmark most worth watching, because it is practical and hard to fake. The gap, benchmark by benchmark Percentage points open trails closed Source: derived from Vellum leaderboards, 2026 Chart 3 — The gap, benchmark by benchmark A horizontal bar chart showing how many percentage points open trails closed on each task. Math: 0.9 points. Science: 6.6 points. Coding: 11.8 points. Hardest exam: 13.0 points. The bars are colour-graded from green (small gap) to red (large gap). Source: derived from chart 2, Vellum leaderboards, 2026. On SWE-bench Verified, which tests whether a model can resolve real software bugs end-to-end, the strongest open models now land within roughly eight points of the best closed ones, and one March 2026 analysis found the very top models clustered within about a single point of each other. For everyday coding work, the open-vs-closed distinction has stopped being the thing that decides quality. Chart 4: The cost difference is enormous Here is the chart that changes the decision for most schools and budget-conscious teams. The cost difference is enormous US$ per 1M output tokens (log scale) Source: Vellum pricing, 2026. Open models run free on your own hardware. Chart 4 — The cost difference is enormous A horizontal bar chart on a log scale of price per 1M output tokens. Open: Gemma 3 27b $0.07, GPT-oss-20b $0.35, DeepSeek V3 $1.10. Closed: Claude Opus 4.8 $25, GPT-5.5 $30. A capable open model can cost roughly 25 to 400 times less per token, and runs free on your own hardware. Source: Vellum pricing, 2026. A leading open model can deliver something close to frontier quality at a fraction of the price, in some comparisons close to frontier quality at a tiny fraction of the cost. And that is when you pay someone else to host it. Download it and run it yourself and the per-token cost goes to zero. You pay for the hardware and the electricity, nothing else. Chart 5: Cheap and capable at the same time The quieter revolution is size. Models small enough to run on a single ordinary GPU now score what only giant models could a year ago. Cost vs capability Science score (GPQA %) vs output $/1M tokens. Up-and-left is better value. Closed=cream, open=orange Source: Vellum, 2026 Chart 5 — Cost vs capability A scatter plot of science-reasoning score (GPQA %, vertical) against output cost per 1M tokens (log scale, horizontal). Closed models (cream diamonds) score 92–94% but sit far to the right (expensive). Open models (orange circles)

The Open vs Closed AI Gap Is Closing. 6 Charts. Read Post »

0
    0
    Your Cart
    Your cart is emptyReturn to Shop
    Scroll to Top